下游集群信息
- Kubernetes 版本: 1.21.14 rke2r1
问题描述:
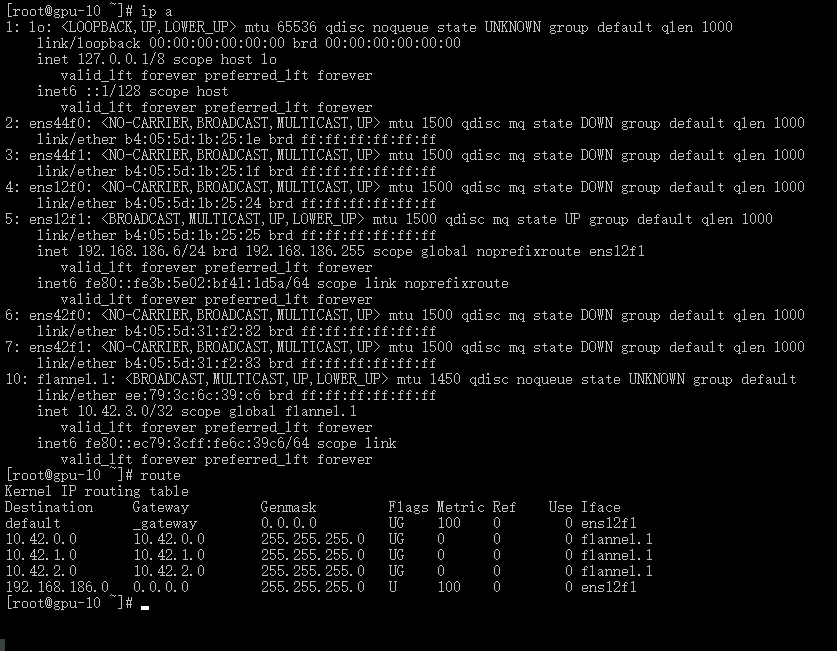
集群中有个多网卡且单独网段的节点,该节点的pod无法访问位于其他节点的DNS。
请问如何解决该问题?
提供的信息无法支撑排查,无详细的环境信息和现象
如果你的flannel使用的vxlan模式,可以查一下fdb转发信息:
bridge fdb show dev flannel.1
集群包含4个节点,如下所示:
[root@istio-245 dns]# kubectl get node -o wide
NAME        STATUS   ROLES                       AGE   VERSION           INTERNAL-IP     EXTERNAL-IP   OS-IMAGE                           KERNEL-VERSION                 CONTAINER-RUNTIME
agent-gpu   Ready    <none>                      17h   v1.21.14+rke2r1   192.168.186.6   <none>        CentOS Linux 8                     4.18.0-305.12.1.el8_4.x86_64   containerd://1.4.13-k3s1
istio-245   Ready    control-plane,etcd,master   18h   v1.21.14+rke2r1   172.16.40.245   <none>        Rocky Linux 8.6 (Green Obsidian)   4.18.0-372.9.1.el8.x86_64      containerd://1.4.13-k3s1
istio-246   Ready    <none>                      18h   v1.21.14+rke2r1   172.16.40.246   <none>        Rocky Linux 8.6 (Green Obsidian)   4.18.0-372.9.1.el8.x86_64      containerd://1.4.13-k3s1
istio-247   Ready    <none>                      18h   v1.21.14+rke2r1   172.16.40.247   <none>        Rocky Linux 8.6 (Green Obsidian)   4.18.0-372.9.1.el8.x86_64      containerd://1.4.13-k3s1
在安装istio后,istio-ingressgateway长时间未就绪:
[root@istio-245 ~]# kubectl get pod -n istio-system -o wide
NAME                                    READY   STATUS    RESTARTS   AGE   IP           NODE        NOMINATED NODE   READINESS GATES
istio-ingressgateway-5f8f6c7465-vq4tr   0/1     Running   0          55m   10.42.3.20   agent-gpu   <none>           <none>
istiod-84dbbf9dc6-rz4fr                 1/1     Running   0          55m   10.42.3.19   agent-gpu   <none>           <none>
istio-ingressgateway的日志显示该pod无法访问集群的dns:
2022-07-12T02:27:36.861438Z     warn    ca      ca request failed, starting attempt 1 in 96.641121ms
2022-07-12T02:27:36.958787Z     warn    ca      ca request failed, starting attempt 2 in 206.455727ms
2022-07-12T02:27:37.166162Z     warn    ca      ca request failed, starting attempt 3 in 436.48165ms
2022-07-12T02:27:37.603792Z     warn    ca      ca request failed, starting attempt 4 in 769.681644ms
2022-07-12T02:27:38.373820Z     warn    sds     failed to warm certificate: failed to generate workload certificate: create certificate: rpc error: code = Unavailable desc = connection error: desc = "transport: Error while dialing dial tcp: lookup istiod.istio-system.svc on 10.43.0.10:53: read udp 10.42.3.20:40374->10.43.0.10:53: i/o timeout"
2022-07-12T02:27:49.724136Z     warning envoy config    StreamAggregatedResources gRPC config stream closed: 14, connection error: desc = "transport: Error while dialing dial tcp: i/o timeout"
2022-07-12T02:28:26.584569Z     warning envoy config    StreamAggregatedResources gRPC config stream closed: 14, connection error: desc = "transport: Error while dialing dial tcp: i/o timeout"
根据rancher文档检查dns,192.168.186.6中的pod无法访问位于其他节点的dns:
[root@istio-245 ~]# kubectl -n kube-system get pods -l k8s-app=kube-dns -o wide
NAME                                         READY   STATUS    RESTARTS   AGE   IP          NODE        NOMINATED NODE   READINESS GATES
rke2-coredns-rke2-coredns-6775f768c8-9sg9b   1/1     Running   0          18h   10.42.1.4   istio-246   <none>           <none>
rke2-coredns-rke2-coredns-6775f768c8-fphvb   1/1     Running   0          18h   10.42.0.2   istio-245   <none>           <none>

[root@istio-245 dns]# export DOMAIN=www.baidu.com; echo "=> Start DNS resolve test"; kubectl get pods -l name=dnstest --
no-headers -o custom-columns=NAME:.metadata.name,HOSTIP:.status.hostIP | while read pod host; do kubectl exec $pod -- /b
in/sh -c "nslookup $DOMAIN > /dev/null 2>&1"; RC=$?; if [ $RC -ne 0 ]; then echo $host cannot resolve $DOMAIN; fi; done;
 echo "=> End DNS resolve test"
=> Start DNS resolve test
command terminated with exit code 1
192.168.186.6 cannot resolve www.baidu.com
=> End DNS resolve test
192.168.186.6的pod可以ping其他节点的pod(包括coredns的pod):
[root@istio-245 ~]# kubectl get pod -o wide
NAME            READY   STATUS    RESTARTS   AGE   IP           NODE        NOMINATED NODE   READINESS GATES
dnstest-fsdfc   1/1     Running   0          23m   10.42.2.19   istio-247   <none>           <none>
dnstest-lrdww   1/1     Running   0          23m   10.42.0.3    istio-245   <none>           <none>
dnstest-vc5bk   1/1     Running   0          23m   10.42.3.21   agent-gpu   <none>           <none>
dnstest-wzj44   1/1     Running   0          23m   10.42.1.10   istio-246   <none>           <none>

[root@istio-245 dns]# kubectl exec -it dnstest-vc5bk  -- bash
bash-4.3# ping 10.42.2.19 -c 1
PING 10.42.2.19 (10.42.2.19): 56 data bytes
64 bytes from 10.42.2.19: seq=0 ttl=62 time=0.780 ms

--- 10.42.2.19 ping statistics ---
1 packets transmitted, 1 packets received, 0% packet loss
round-trip min/avg/max = 0.430/0.567/0.780 ms

bash-4.3# ping 10.42.1.4 -c 1
PING 10.42.1.4 (10.42.1.4): 56 data bytes
64 bytes from 10.42.1.4: seq=0 ttl=62 time=0.579 ms

--- 10.42.1.4 ping statistics ---
1 packets transmitted, 1 packets received, 0% packet loss
round-trip min/avg/max = 0.579/0.579/0.579 ms
这是各个节点执行bridge fdb show dev flannel.1的结果:
[root@agent-gpu ~]# bridge fdb show dev flannel.1
8a:70:16:5e:d9:11 dst 172.16.40.245 self permanent
1a:96:46:e5:61:32 dst 172.16.40.247 self permanent
02:1a:af:18:36:05 dst 172.16.40.246 self permanent

[root@istio-245 dns]# bridge fdb show dev flannel.1
ee:79:3c:6c:39:c6 dst 192.168.186.6 self permanent
1a:96:46:e5:61:32 dst 172.16.40.247 self permanent
02:1a:af:18:36:05 dst 172.16.40.246 self permanent

[root@istio-246 dns]# bridge fdb show dev flannel.1
ee:79:3c:6c:39:c6 dst 192.168.186.6 self permanent
8a:70:16:5e:d9:11 dst 172.16.40.245 self permanent
1a:96:46:e5:61:32 dst 172.16.40.247 self permanent

[root@istio-247 dns]# bridge fdb show dev flannel.1
ee:79:3c:6c:39:c6 dst 192.168.186.6 self permanent
8a:70:16:5e:d9:11 dst 172.16.40.245 self permanent
02:1a:af:18:36:05 dst 172.16.40.246 self permanent